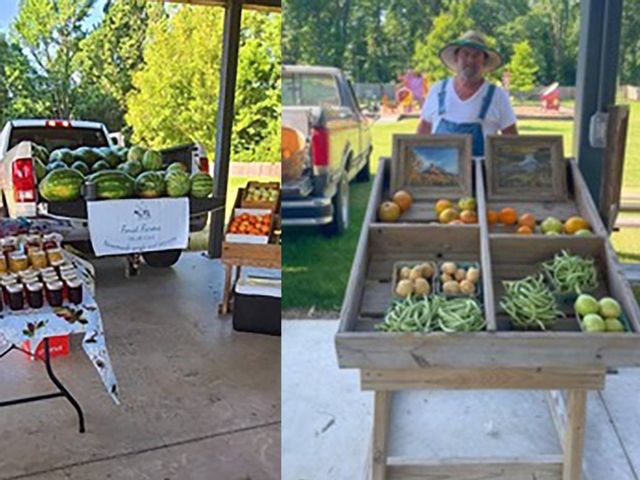
We will provide the support needed to create a vibrant and healthy quality of life within our community. The Retail Development Division will work closely with LRK, LLC hired by the Joint Economic Community Development Board to create a comprehensive retail development plan for Brownsville, Stanton, and Haywood County.
The Retail Development Division will develop an avenue of awareness, growth, and value for our Retail Chamber Members.

We are determined to let everyone know how important it is to “Shop Local!” When you shop locally more money is kept within the community. Buying locally helps grow other businesses as well as grows our tax base.
In order to encourage shopping locally, the Chamber manages and supports “Chamber Bucks” a great way to support our local businesses. Call the chamber for more information on this Chamber Member Value-Added Program
Benchmark: USA | Brownsville, TN | Haywood County, TN |
Population | ||
2000 Census | 10,768 | 10,768 |
2010 Census | 10,292 | 18,787 |
2022 Estimate | 9,072 | 9,072 |
2027 Projection | 8,911 | 16,529 |
Population Growth | ||
Percent Change: 2000 to 2010 | -4.42 | -5.1 |
Percent Change: 2010 to 2022 | -11.85 | -10.59 |
Percent Change: 2022 to 2027 | -1.77 | -1.6 |
Households | ||
2000 Census | 4,132 | 7,558 |
2010 Census | 4,150 | 7,459 |
2022 Estimate | 3,733 | 6,789 |
2027 Projection | 3,684 | 6,711 |
Household Growth | ||
Percent Change: 2000 to 2010 | 0.44 | -1.31 |
Percent Change: 2010 to 2022 | -10.05 | -8.98 |
Percent Change: 2022 to 2027 | -1.31 | -1.15 |
Family Households | ||
2000 Census | 2,894 | 5,418 |
2010 Census | 2,759 | 5,112 |
2022 Estimate | 2,481 | 4,660 |
2022 Estimate | 2,450 | 4,611 |
Family Household Growth | ||
Percent Change: 2000 to 2010 | -4.67 | -5.65 |
Percent Change: 2010 to 2022 | -10.08 | -8.84 |
Percent Change: 2010 to 2022 | -1.25 | -1.05 |